


December Recap:
The Caldwell Canadian Value Momentum Fund (“CVM”) gained 2.1% in December versus a gain of 3.1% for the S&P/TSX Composite Total Return Index (“Index”)1. Sector returns within the Index continued to have a wide range of outcomes. Technology (-6.6%), Health Care (-5.6%) and Industrials (-0.2%) were the worst performing sectors while 8/11 sectors posted positive returns, led by Consumer Staples (+9.2%) and Consumer Discretionary (+7.3%). Real Estate and Financials were also top performers which marked a continuation of strong performance throughout 2021 (more on full year performance below).
Top performers in December were AirBoss ("BOS" +15.2%), Interfor ("IFP" +27.0%) and NuVista ("NVA" +12.4%)2.
BOS was a top performer for the second consecutive month and disclosed that it's bid pipeline, a key driver of growth over the next 18-24 months, grew 50% from just a few months ago to $1.5B. The company is seeing success in the healthcare market and is well positioned versus competing bidders to capture a significant contract with the U.S. Department of Health and Human Services. A surge in lumber prices and strong U.S. housing demand took IFP higher. Lastly, higher oil prices helped take NVA up, along with other names in the Energy sector.
Two stocks were added to the portfolio in December: Headwater Exploration ("HWX") and Interfor ("IFP")2. HWX is a small cap oil and gas exploration company with exposure to some of the best well economics in Alberta. A clean balance sheet allows the company to pursue accretive acquisitions in addition to its organic opportunities, which has created one of the most attractive growth profiles in the industry. As discussed above, IFP stands to benefit from a robust North American housing market. Additionally, the recent acquisition of Eacom adds considerable scale, geographical diversification, increased exposure to engineered wood products and is expected to generate cost synergies soon after closing.
The Fund held a 22% cash weighting at month-end. The CVM has generated substantial value to investors over its long-term history driven by the combination of strong company-specific catalysts and a concentrated portfolio. We continue to look forward to strong results as we progress through 2022 and beyond.
Full Year 2021 Recap:
CVM had another solid year in 2021, gaining 24.2% versus 25.1% for the Index1.
2021 saw a notable change in market leadership, as the underperformers of 2020 shone through in 2021. Energy, the worst performing sector last year, became the top performing sector in 2021, followed by Real Estate and Financials. Relative to 2020, Information Technology saw a significant drop-off in performance, as some of the higher-volatility, longer-duration growth stories experienced a sell-off late in the year. This decline was driven largely by investor concerns surrounding rising inflation and expectations of impending interest rate hikes. Accounting for about one third of the Index by weight, Financials contributed approximately 11% of the Index’s 25.1% return in 2021, with the top five Canadian banks accounting for the lion’s share of this performance. CVM’s strong annual performance was generated without exposure to any Canadian banks. We believe this exemplifies the benefits of diversification offered by CVM and reinforces the view of the fund as a complementary addition to most investment portfolios.
As a reminder, the CVM seeks to own stocks undergoing a positive re-rating by the market and is designed to adjust quickly to changing market dynamics. With that in mind, there were no shortage of risks to navigate through 2021, as market performance seemed to be largely driven by ever-changing daily headlines. Rising inflation, leading to surging commodity and food prices, new COVID variants and economic lockdowns, supply chain disruptions and the Bank of Canada announcing the end of its quantitative easing program were but a few of the headwinds rattling markets day-to-day.
Commodities, namely energy, were the large beneficiaries of rising inflation. CVM initiated an allocation to energy in late 2020 as positive momentum began to build. While the fund maintained only a slight overweight to energy throughout the past year, the returns generated by CVM in this sector were more than 3.5 times those of the Index.
Real Estate finished the year strong, gaining more than 37% as a result of strong demand for housing in both residential and commercial properties. CVM participated in these gains through continued exposure to FirstService Corp (“FSV”) and additions to the portfolio such as Tricon Residential (“TCN”) and Colliers International Group (“CIGI”)2.
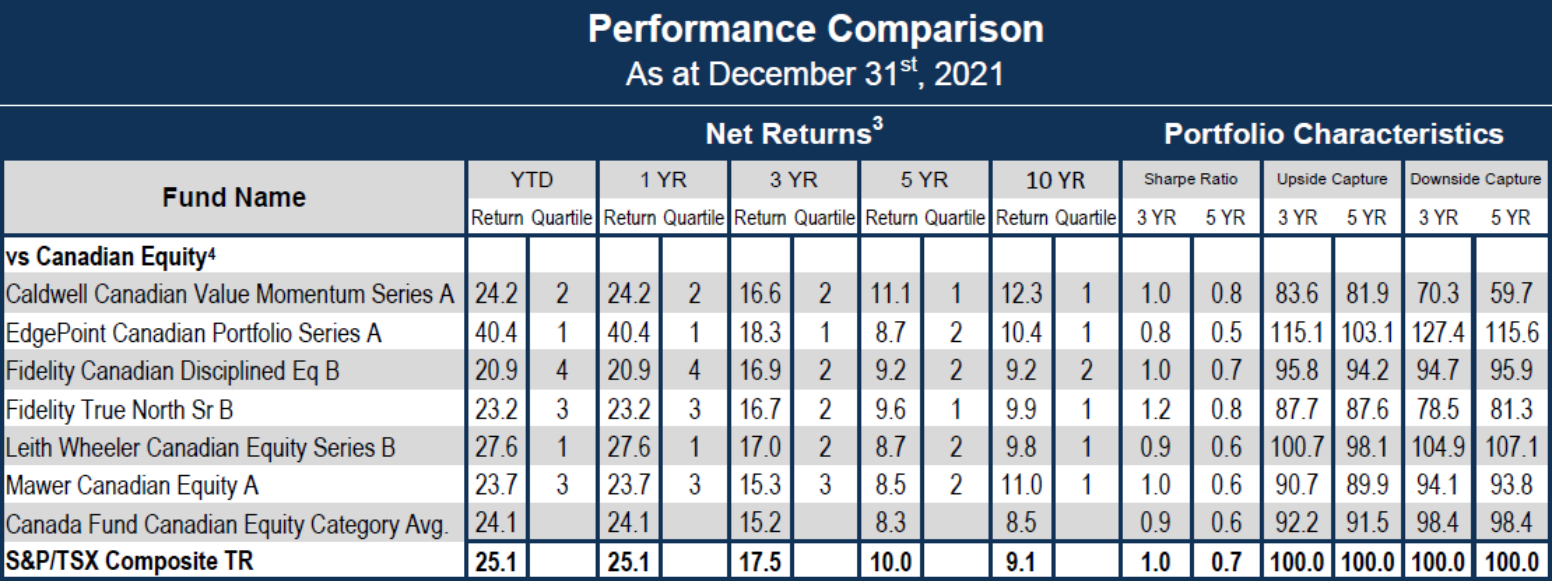
1See Performance Comparison table (page 3 of the PDF) for standard performance data.
2Actual Investments, first purchased: BOS 10/14/2020, IFP 11/13/2020, NVA 3/10/2021, HWX 12/7/2021, FSV 10/29/2020, TCN 9/14/2021, CIGI 11/3/2021.
3Return since August 15, 2011 (Perf. Start Date): CVM 11.34%, Index 8.3%. | Returns are annualized for periods greater than one year. | Source: Morningstar
4Categories defined by Canadian Investment Funds Standards Committee (“CIFSC”).
The CVM was not a reporting issuer offering its securities privately from August 8, 2011 until July 20, 2017, at which time it became a reporting issuer and subject to additional regulatory requirements and expenses associated therewith.
Unless otherwise specified, market and issuer data sourced from Capital IQ.
As the constituents in the Canadian Equity category largely focus on securities of a larger capitalization and CVM considers, and is invested, in all categories, including smaller and micro-cap securities, we have also shown how CVM ranks against constituents focused in the smaller cap category. The above list represents 6 of a total of 374 constituents in the Canadian Equity category.
The information contained herein provides general information about the Fund at a point in time. Investors are strongly encouraged to consult with a financial advisor and review the Simplified Prospectus and Fund Facts documents carefully prior to making investment decisions about the Fund. Commissions, trailing commissions, management fees and expenses all may be associated with mutual fund investments. Rates of returns, unless otherwise indicated, are the historical annual compounded returns including changes in unit value and reinvestment of all distributions and do not take into account sales, redemption, distribution or optional charges or income taxes payable by any unitholder that would have reduced returns. Mutual funds are not guaranteed; their values change frequently and past performance may not be repeated.
FundGrade A+® is used with permission from Fundata Canada Inc., all rights reserved. The annual FundGrade A+® Awards are presented by Fundata Canada Inc. to recognize the “best of the best” among Canadian investment funds. The FundGrade A+® calculation is supplemental to the monthly FundGrade ratings and is calculated at the end of each calendar year. The FundGrade rating system evaluates funds based on their risk-adjusted performance, measured by Sharpe Ratio, Sortino Ratio, and Information Ratio. The score for each ratio is calculated individually, covering all time periods from 2 to 10 years. The scores are then weighted equally in calculating a monthly FundGrade. The top 10% of funds earn an A Grade; the next 20% of funds earn a B Grade; the next 40% of funds earn a C Grade; the next 20% of funds receive a D Grade; and the lowest 10% of funds receive an E Grade. To be eligible, a fund must have received a FundGrade rating every month in the previous year. The FundGrade A+® uses a GPA-style calculation, where each monthly FundGrade from “A” to “E” receives a score from 4 to 0, respectively. A fund’s average score for the year determines its GPA. Any fund with a GPA of 3.5 or greater is awarded a FundGrade A+® Award. For more information, see www.FundGradeAwards.com. Although Fundata makes every effort to ensure the accuracy and reliability of the data contained herein, the accuracy is not guaranteed by Fundata.
Publication date: January 19, 2022.