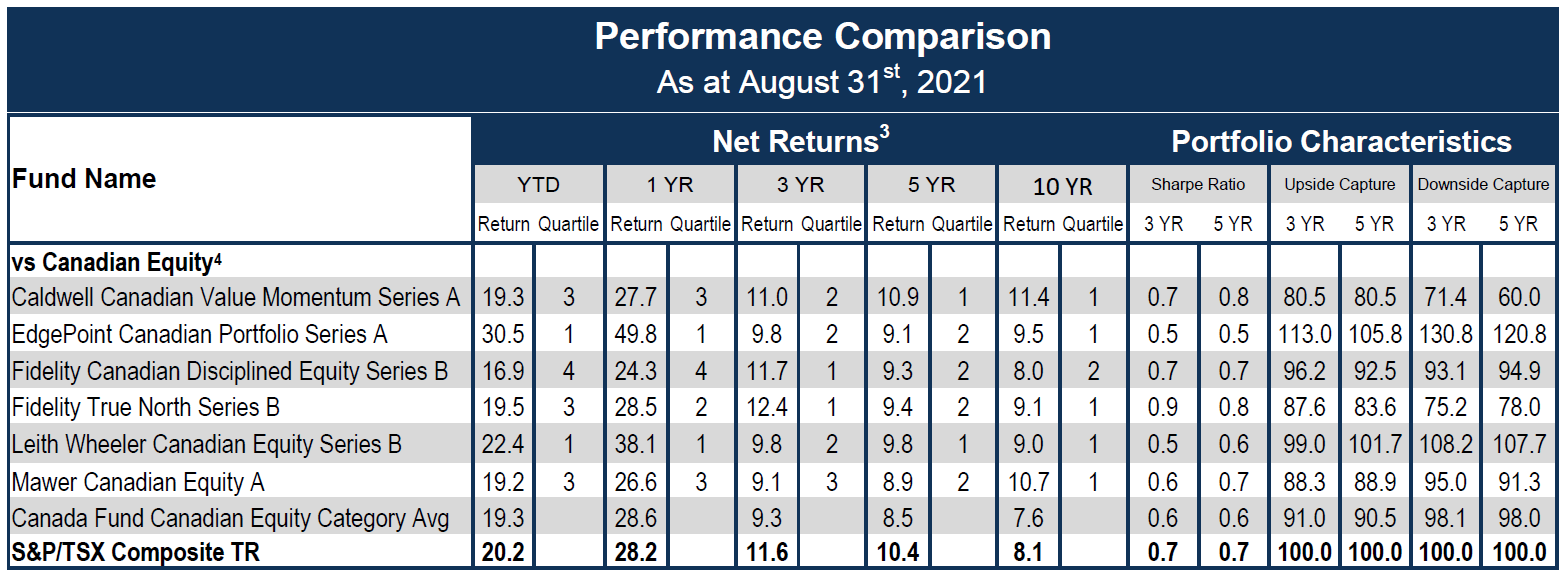
August Recap: The Caldwell Canadian Value Momentum Fund (“CVM”) gained 0.2% in August versus a gain of 1.6% for the S&P/TSX Composite Total Return Index (“Index”)1. Sector returns within the Index continued to have a wide range of outcomes. Technology (+5.8%) was August's strongest performing sector while Materials (-2.8%) lagged on weakness in gold and base metals.
Top CVM performers in August were ATS Automation (“ATA” +21.5%), Stelco (“STLC” +20.0%) and Advantage Energy (“AAV” +11.9%)2.
ATA reported a strong earnings beat with record bookings and backlog driven by wins in life sciences, food & beverage and EV end markets. The backdrop for automation remains positive given tight labour markets and ongoing supply chain disruptions.
STLC announced a significant share repurchase agreement that will reduce shares outstanding by 13%. Shares were repurchased at $34.93, a 26% discount to the last closing price at the time of the announcement. The company continues to generate significant amounts of cash on the back of high steel prices. Management are significant shareholders and therefore well-aligned with investors to allocate excess cash in a manner that increases shareholder value.
AAV moved higher with natural gas prices and increased estimates for it's Entropy subsidiary, which is focused on carbon capture and storage. AAV is currently seeking external funding for Entropy via private placement which will provide clarity on the asset's value. It seems that investors today are getting a relatively cheap option on this asset.
Four stocks were added to the portfolio in August: CI Financial (“CIX”), Gildan Activewear (“GIL”), Bombardier (“BBD.B”) and Alimentation Couche-Tard (“ATD.B”).
A new management team at CIX is successfully transforming the business. Fund flows within asset management were net positive this past quarter for the first time in four years on widespread changes to investment teams, sales & marketing, and product development. Wealth Management has grown significantly through M&A, with AUA surpassing AUM for the first time ever. Wealth Management segment EBITDA is up to a $196 million run rate versus $17 million two years ago and there continues to be a long growth runway as CIX uses its scale to leverage technology capabilities to be the buyer of choice in a fragmented U.S. Registered Investment Advisor market.
Positive drivers at GIL include accelerating demand as economies reopen, constrained industry supply, market share gains given an advantaged supply chain versus peers, and a significantly improved cost structure following a restructuring program.
BBD.B shares are essentially trading in line with pre-COVID levels despite a much stronger corporate jet market (an attractive substitute for commercial flying), significantly de-risked balance sheet, completed divestment of the troubled rail business, and new management team. Lastly, after negative M&A-related sentiment, we expect investors are better appreciating
ATD.B's organic growth opportunities following its Investor Day in which the company outlined plans to (again) double EBITDA by Fiscal 2023. Strong earnings performance through a dynamic operating environment have also helped share price performance.
The Fund held a 20.6% cash weighting at month-end. The CVM has generated substantial value to investors over its long-term history driven by the combination of strong company-specific catalysts and a concentrated portfolio. We continue to look forward to strong results as we progress through 2021 and beyond.
1See Performance Comparison table (or page 2 of the PDF) for standard performance data.
2Actual Investments, first purchased: ATA 2/16/2018, AAV 7/22/2021, STLC 10/26/2020.
3Return since August 15, 2011 (Perf. Start Date): CVM 11.3%, Index 8.2%. | Returns are annualized for periods greater than one year. | Source: Morningstar
4Categories defined by Canadian Investment Funds Standards Committee (“CIFSC”).
The CVM was not a reporting issuer offering its securities privately from August 8, 2011 until July 20, 2017, at which time it became a reporting issuer and subject to additional regulatory requirements and expenses associated therewith.
Unless otherwise specified, market and issuer data sourced from Capital IQ.
As the constituents in the CIFSC Canadian Equity category largely focus on securities of a larger capitalization and CVM considers, and is invested, in all categories, including smaller and micro-cap securities, we have also shown how CVM ranks against constituents focused in the smaller cap category. The above list represents 6 of a total of 391 constituents in the CIFSC Canadian Equity category.
The information contained herein provides general information about the Fund at a point in time. Investors are strongly encouraged to consult with a financial advisor and review the Simplified Prospectus and Fund Facts documents carefully prior to making investment decisions about the Fund. Commissions, trailing commissions, management fees and expenses all may be associated with mutual fund investments. Rates of returns, unless otherwise indicated, are the historical annual compounded returns including changes in unit value and reinvestment of all distributions and do not take into account sales, redemption, distribution or optional charges or income taxes payable by any unitholder that would have reduced returns. Mutual funds are not guaranteed; their values change frequently and past performance may not be repeated.
The Refinitiv Lipper Fund Awards are based on the Lipper Leader for Consistent Return rating, which is a risk-adjusted performance measure calculated over 36, 60 and 120 months. Lipper Leaders fund ratings do not constitute and are not intended to constitute investment advice or an offer to sell or the solicitation of an offer to buy any security of any entity in any jurisdiction. For more information, see lipperfundawards.com. The CVM in the Canadian Equity Category for the 5-year period (out of a total of 74 funds) ending 7/31/2020 with corresponding Lipper Leader ratings of 4 (3 years) and 5 (5 years).
FundGrade A+® is used with permission from Fundata Canada Inc., all rights reserved. The annual FundGrade A+® Awards are presented by Fundata Canada Inc. to recognize the “best of the best” among Canadian investment funds. The FundGrade A+® calculation is supplemental to the monthly FundGrade ratings and is calculated at the end of each calendar year. The FundGrade rating system evaluates funds based on their risk-adjusted performance, measured by Sharpe Ratio, Sortino Ratio, and Information Ratio. The score for each ratio is calculated individually, covering all time periods from 2 to 10 years. The scores are then weighted equally in calculating a monthly FundGrade. The top 10% of funds earn an A Grade; the next 20% of funds earn a B Grade; the next 40% of funds earn a C Grade; the next 20% of funds receive a D Grade; and the lowest 10% of funds receive an E Grade. To be eligible, a fund must have received a FundGrade rating every month in the previous year. The FundGrade A+® uses a GPA-style calculation, where each monthly FundGrade from “A” to “E” receives a score from 4 to 0, respectively. A fund’s average score for the year determines its GPA. Any fund with a GPA of 3.5 or greater is awarded a FundGrade A+® Award. For more information, see www.FundGradeAwards.com. Although Fundata makes every effort to ensure the accuracy and reliability of the data contained herein, the accuracy is not guaranteed by Fundata.
Publication date: September 14, 2021.


