December 2020 Recap:
The Caldwell Canadian Value Momentum Fund (“CVM”) gained 5.9% in December versus a gain of 1.7% for the S&P/TSX Composite Total Return Index (“Index”)1.
Top CVM performers in December were Xebec Adsorption (“XBC”: +50.3%), Maxar Technologies (“MAXR”: +36.4%) and Stelco (“STLC”: +35.6%)2.
Multiple catalysts drove XBC shares higher, including a transformative acquisition in the green hydrogen space (concurrent with a bought-deal public offering and private placement by Caisse de Depot), positive investor sentiment around clean energy given increasing commitments by governments to support the industry, and a graduation to the TSX main board from the venture exchange.
MAXR moved higher following conference appearances where management highlighted the company's opportunities within the space market.
STLC moved higher along with other industrial commodity producers as investor sentiment continued to shift towards cyclical recovery plays.
Six stocks were added to the portfolio in December: Karora Resources (“KRR”), Canfor Corp. (“CFP”), Seven Generations Energy (“VII”), Major Drilling (“MDI”), Stella Jones (“SJ”), and Dye & Durham (“DND”).
We view KRR as an under-covered gold producer early in its catalyst cycle following the renegotiation of royalty commitments by a new management team.
CFP increases exposure to continued strength in U.S. housing starts and renovation/remodel activity with additional upside from capital deployment optionality.
After an extended period of minimal or no exposure to the Energy sector, we initiated on VII. Commodity prices have improved meaningfully from their lows after an extended period of capital discipline and under-investment across the industry. This is driving significant improvements in free cash flow generation at exploration and production companies, especially as cost structures are also materially lower versus prior years. Specific to VII, the outlook for natural gas and condensate looks positive, with VII best positioned to benefit as Canada's largest condensate producer.
MDI appears to be in the early innings of a growth cycle, driven by strong metal prices and a robust year of financing activity for mining companies in 2020, which should drive growing exploration activity going forward.
SJ is a leading North American supplier of pressure treated wood products, with 2/3 of revenue coming from mainly replacement demand in utility poles and railway ties. We expect shares to move higher as SJ executes on a meaningful pipeline of acquisition opportunities.
Lastly, DND is executing a roll-up strategy of mission-critical software used by legal offices for business and real estate transactions. DND has leadership positions within these niche markets and geographies with strong pricing power, sticky revenue, a large and fragmented addressable market and significant multiple arbitrage on acquisitions.
Full Year 2020 Recap:
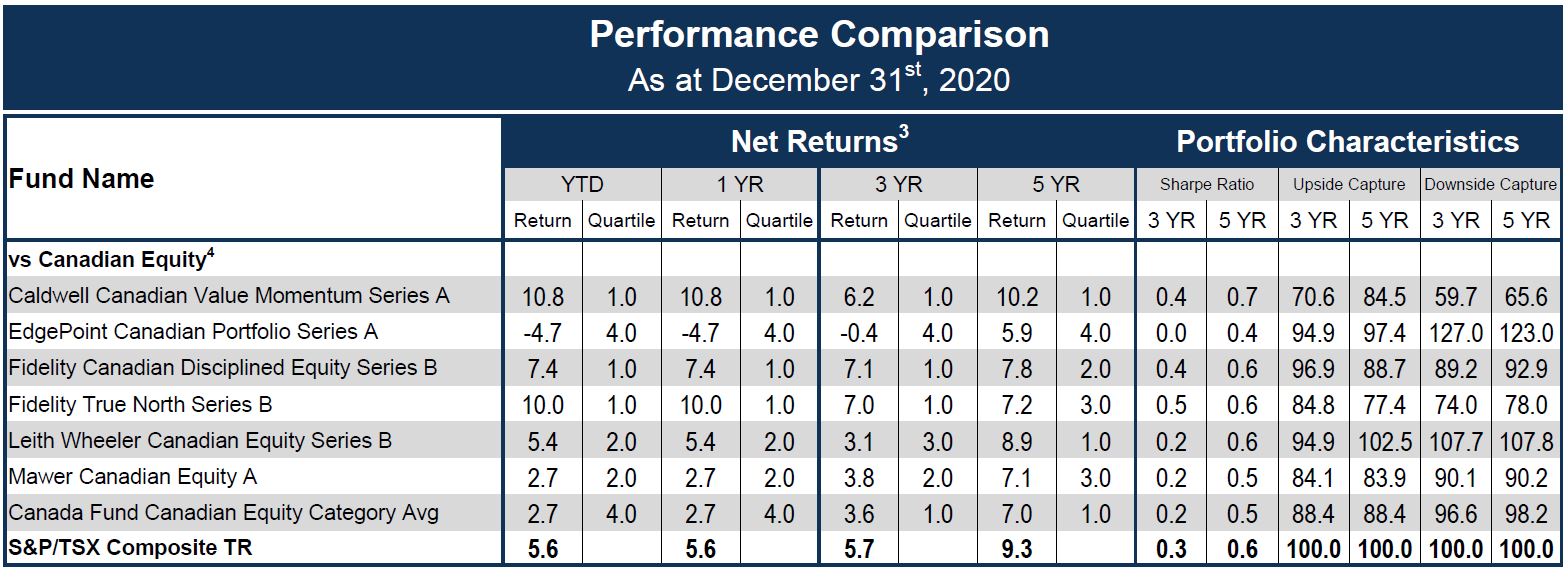
The CVM gained 10.8% in 2020 versus a gain of 5.6% for the Index.1 A notable driver of the Index's performance in 2020 was Shopify (“SHOP”), which continued its strong rise and accounted for approximately 400 basis points (or about 71%) of the Index's return in 2020. As such, we are extra pleased with the CVM's performance given no exposure to SHOP throughout the year. For reference, the CIFSC Canadian Equity Peer group gained only 2.4% in 2020, putting the CVM in the top decile of performers.
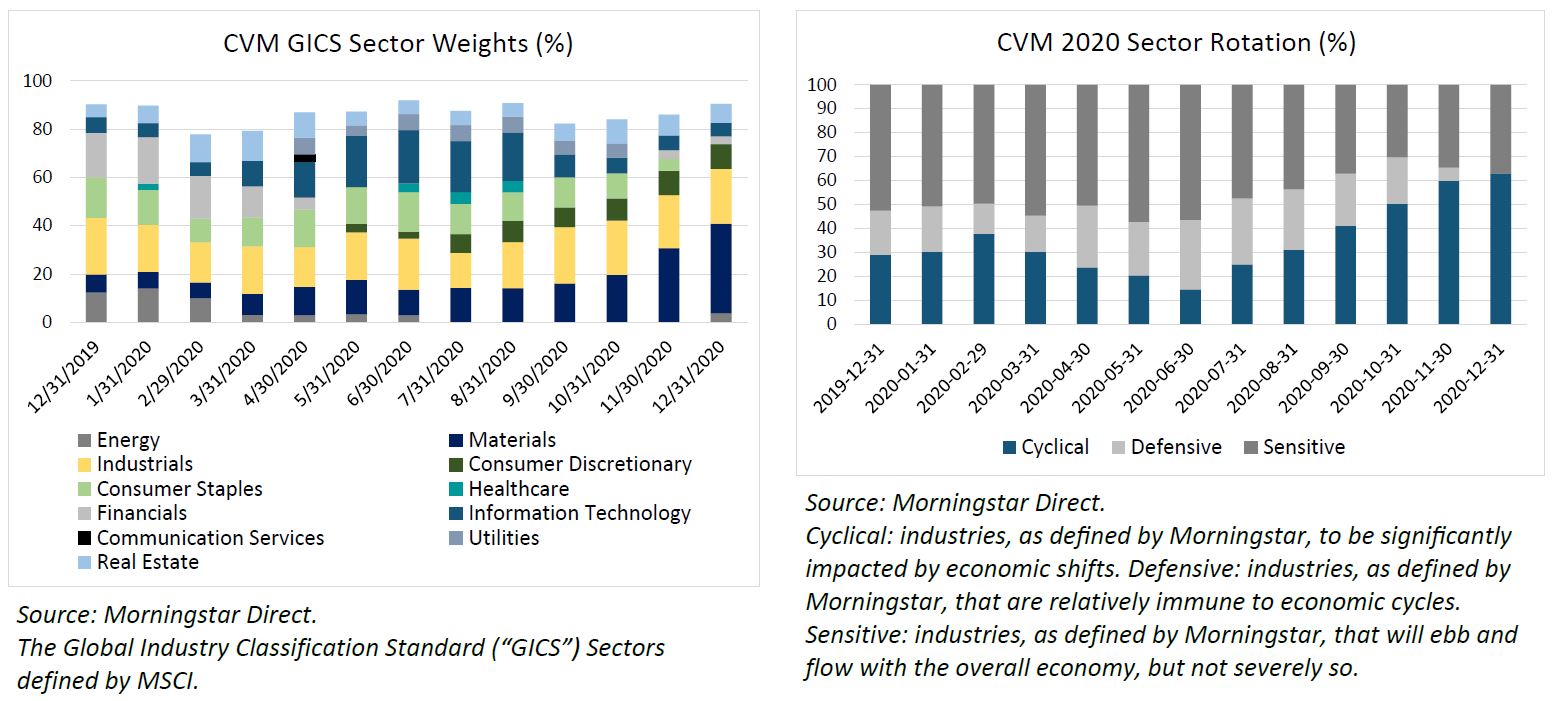
As a reminder, the CVM seeks to own stocks undergoing a positive re-rating by the market and is designed to adjust quickly to changing market dynamics. As such, it was an active year as the CVM re-positioned alongside two major rotations within the market. The first was the COVID-19 driven sell off and subsequent rotation into stocks benefiting from the pandemic. These included: Cargojet (“CJT”), which benefited from a surge in online shopping combined with a decrease in air freight capacity from idled passenger aircraft; Real Matters (“REAL”), which benefited from a sharp decline in interest rates that led to robust mortgage refinancing activity; BRP (“DOO”), which benefited from consumers shifting spending towards the home, and Kinaxis (“KXS”), which benefited from a resilient software business model and demand for its supply chain management solutions2.

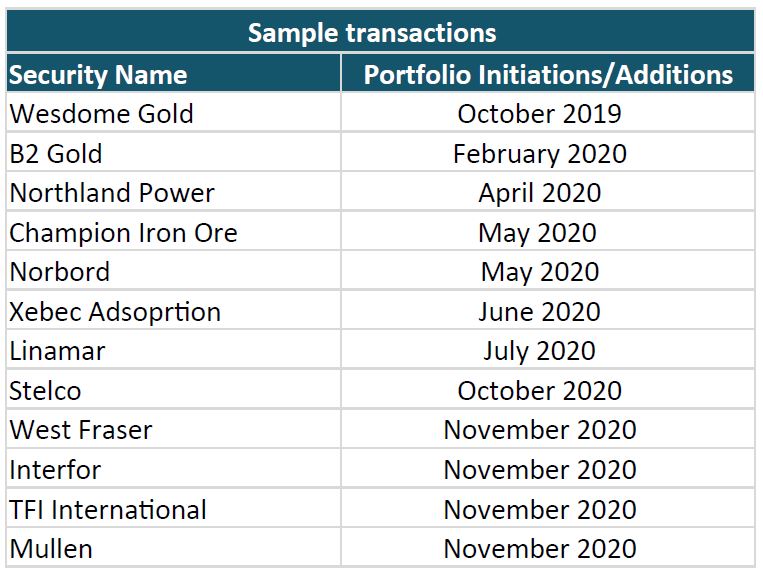
The second rotation involved investors shifting into early cycle recovery names. This shift began right off the market bottom in March, gained further steam following Q2 results once investors saw what 'worst case' earnings looked like, and shifted into high gear in early November alongside vaccine news and early U.S. election results. The CVM participated with this shift, illustrated through purchases like Champion Iron Ore (“CIA”) and Norbord (“OSB”), Linamar (“LNR”), Stelco (“STLC”), West Fraser (“WFT”), Interfor (“IFP”), TFI International (“TFII”), and Mullen (“MTL”)2. The charts below illustrate these rotations within the portfolio.
Other major themes in 2020 were the positive momentum in clean energy and gold stocks, which the CVM participated in through Northland Power (“NPI”), Xebec Adsoprtion (“XBC”), Wesdome Gold (“WDO”) and B2 Gold (“BTO”)2.
Looking forward, we will continue to seek out positive re-rating opportunities and make necessary adjustments to positioning based on changing market dynamics.
The Fund held a 9.5% cash weighting at month-end. The CVM has generated substantial value to investors over its long-term history driven by the combination of strong company-specific catalysts and a concentrated portfolio. We continue to look forward to strong results as we progress through 2021 and beyond.
We thank you for your continued support.
The CVM Team
1See Performance Comparison table (page 3 of the PDF) for standard performance data.
2Actual Investments, first purchased: XBC 6/10/2020, MAXR 9/1/2020, STLC 10/26/2020, CIA 6/28/2019, LNR 7/2/2020, STLC 10/26/2020, WFT 11/3/2020,
IFP 11/13/2020, TFII 1/27/2017, MTL 11/16/2020, BTO 2/26/2020, CJT 9/28/2016, REAL 8/20/2019, DOO 4/6/2017, KXS 4/8/2020.
Former Investments, sold: OSB 12/23/2020, NPI 11/11/2020, WDO 12/4/2020.
3Return since August 15, 2011 (Perf. Start Date): CVM 10.1%, Index 6.6%. | Returns are annualized for periods greater than one year. | Source: Morningstar
4Categories defined by Canadian Investment Funds Standards Committee (“CIFSC”).
The CVM was not a reporting issuer offering its securities privately from August 8, 2011 until July 20, 2017, at which time it became a reporting issuer and subject to additional regulatory requirements and expenses associated therewith.
Unless otherwise specified, market and issuer data sourced from Capital IQ.
As the constituents in the Canadian Equity category largely focus on securities of a larger capitalization and CVM considers, and is invested, in all categories, including smaller and micro-cap securities, we have also shown how CVM ranks against constituents focused in the smaller cap category. The above list represents 6 of a total of 374 constituents in the Canadian Equity category.
The information contained herein provides general information about the Fund at a point in time. Investors are strongly encouraged to consult with a financial advisor and review the Simplified Prospectus and Fund Facts documents carefully prior to making investment decisions about the Fund. Commissions, trailing commissions, management fees and expenses all may be associated with mutual fund investments. Rates of returns, unless otherwise indicated, are the historical annual compounded returns including changes in unit value and reinvestment of all distributions and do not take into account sales, redemption, distribution or optional charges or income taxes payable by any unitholder that would have reduced returns. Mutual funds are not guaranteed; their values change frequently and past performance may not be repeated.
The Refinitiv Lipper Fund Awards are based on the Lipper Leader for Consistent Return rating, which is a risk-adjusted performance measure calculated over 36, 60 and 120 months. Lipper Leaders fund ratings do not constitute and are not intended to constitute investment advice or an offer to sell or the solicitation of an offer to buy any security of any entity in any jurisdiction. For more information, see lipperfundawards.com. The CVM in the Canadian Equity Category for the 5-year period (out of a total of 74 funds) ending 7/31/2020 with corresponding Lipper Leader ratings of 4 (3 years) and 5 (5 years).
FundGrade A+® is used with permission from Fundata Canada Inc., all rights reserved. The annual FundGrade A+® Awards are presented by Fundata Canada Inc. to recognize the “best of the best” among Canadian investment funds. The FundGrade A+® calculation is supplemental to the monthly FundGrade ratings and is calculated at the end of each calendar year. The FundGrade rating system evaluates funds based on their risk-adjusted performance, measured by Sharpe Ratio, Sortino Ratio, and Information Ratio. The score for each ratio is calculated individually, covering all time periods from 2 to 10 years. The scores are then weighted equally in calculating a monthly FundGrade. The top 10% of funds earn an A Grade; the next 20% of funds earn a B Grade; the next 40% of funds earn a C Grade; the next 20% of funds receive a D Grade; and the lowest 10% of funds receive an E Grade. To be eligible, a fund must have received a FundGrade rating every month in the previous year. The FundGrade A+® uses a GPA-style calculation, where each monthly FundGrade from “A” to “E” receives a score from 4 to 0, respectively. A fund’s average score for the year determines its GPA. Any fund with a GPA of 3.5 or greater is awarded a FundGrade A+® Award. For more information, see www.FundGradeAwards.com. Although Fundata makes every effort to ensure the accuracy and reliability of the data contained herein, the accuracy is not guaranteed by Fundata.
Publication date: January 22, 2020.


