June 2020 Recap:
The Caldwell Canadian Value Momentum Fund (“CVM” or ”Fund”) out-performed the S&P/TSX Composite Total Return Index (“Index”) by 100 basis points, with a gain of 3.5% in June versus a gain of 2.5% for the Index, as the market continued its COVID-19 snap back rally. The range of outcomes remained wide with Technology (+13.5%) continuing to lead the market's rally. On the other hand, five of the Index's eleven sectors posted a negative return for the month: Energy (-5.3%), Communication Services (-3.6%), Health Care (-3.5%), Utilities (-1.0%) and Consumer Staples (-0.6%). It's interesting to note that many so-called defensive sectors were among the group with negative returns.
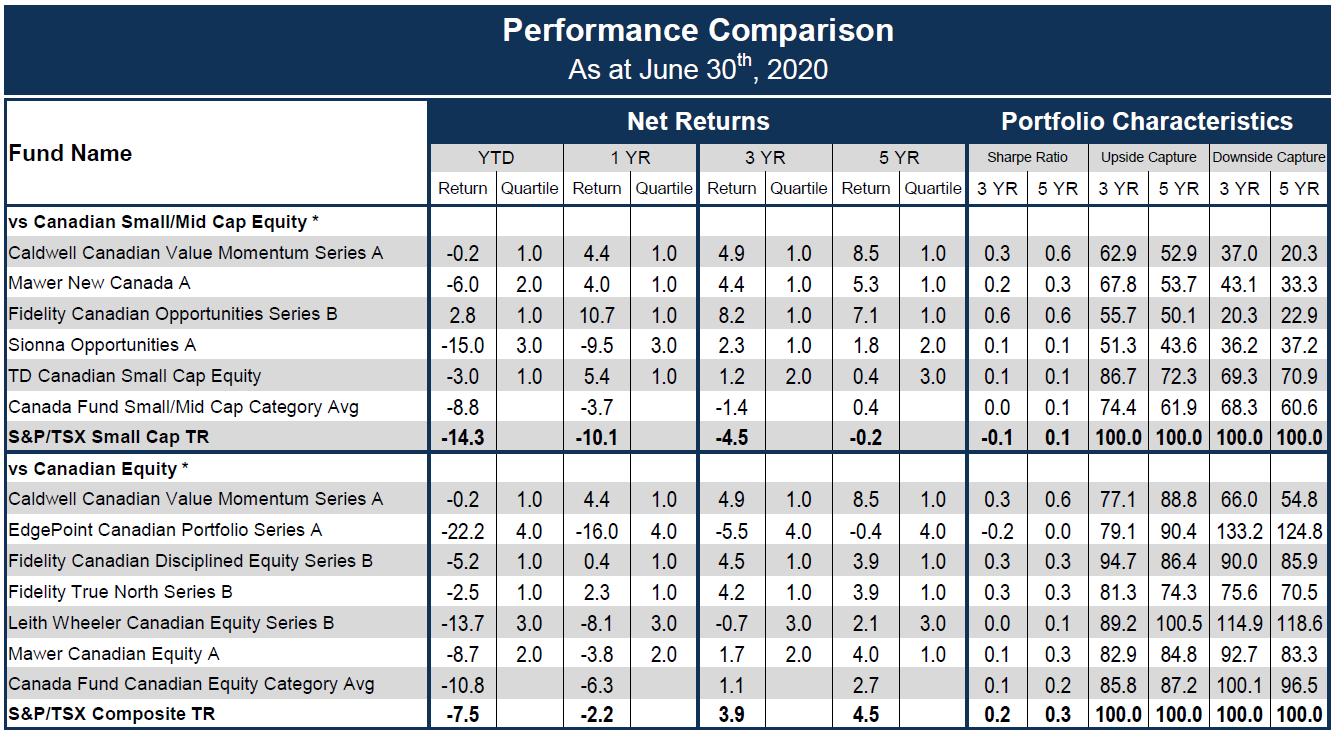
A quick review of first half performance shows that this has been an interesting year for investors. While many retail investors will hear the media quote the Index down 7.5% in the first half of the year (“YTD”), investors could have experienced significantly different outcomes depending on which sectors they were exposed to. Technology, for example, is up a whopping 61.8% YTD while the Gold sub-industry is up 37.2%. Alternately, Energy (-32.4%), Health Care (-31.3%), REITs (-23.3%), Financials (-18.2%), Consumer Discretionary (-11.9%) and Communication Services (-11.2%) are all down double-digits.
Two of the CVM's features we often highlight are i) the strategy's ability to quickly adapt to changing markets and ii) its downside protection.
The two go hand in hand and have clearly been validated in this year's volatile market. The ability to adapt to changing market dynamics has also led the Fund to exhibit the best overall capture, a combination of upside and downside performance, among Canadian equity Funds. The CVM has out-performed the index in five of the six months through the first half of 2020, gaining 730 basis points YTD with a slight decline of 0.2% versus a loss of 7.5% for the Index. This is the result of quickly adjusting to the COVID-19 driven market - portfolio turnover to date is 112% at the time of writing - with the CVM gaining exposure to strong performers while reducing exposure to weak ones. Through navigating this market, we have observed something quite remarkable: even though the world has been completely upended by COVID-19, there are companies that are stronger today than they were pre-COVID-19. This shows that opportunities will always be available to investors, even amidst widespread disruption. Many investors are worried about the long-term impacts of COVID-19 and governments' subsequent spending: in our view, the CVM is the ideal vehicle for investors looking for a way to navigate that uncertainty and find opportunities within change.
Top CVM performers in June were Enghouse (“ENGH” +21.2%) and Cargojet (“CJT” +21.1%).
Enghouse is one company that is benefiting from COVID-19's disruption. In its quarterly results conference call in early June, it noted an overall positive financial impact from solutions that support remote work. ENGH increased its dividend by 22.7% in May, a key indicator of a positive outlook, especially in today's environment where many companies are maintaining or cutting dividends given demand uncertainty.
Cargojet continues to see favorable demand for its air cargo services given the combination of accelerating e-commerce adoption and continued weakness in passenger flights, which historically carried cargo. CJT is yet another example of stronger today versus pre-COVID-19.
Two stocks were added to the portfolio in June: Viemed (“VMD”) and Xebec Adsorption (“XBC”).
VMD provides home respiratory services to patients struggling with various respiratory diseases, including Chronic obstructive pulmonary disease (“COPD”) which is the 3rd largest health-related killer in the U.S. behind heart disease and cancer. Given COVID-19 is a respiratory illness, VMD has been a key player in fighting the disease. We like the company's long growth runway - which will likely be accelerated by COVID-19, capital light business model, strong balance sheet (0.6x net leverage), insider ownership (13%) and a deferred reimbursement risk story.
Xebec makes products that transform raw gases into clean energy. The company is seeing high demand by gas utilities that are desperate to find renewable content given increasing regulatory requirements. Xebec has a leading technology that delivers a cost advantage over other technologies. The company has a significant growth runway and we see multiple catalysts to increase value, including additional support acquisitions and continued demand from gas utilities. Lastly, we believe both VMD and XBC are under-covered by the analyst community and view initiations of coverage as added catalysts.
The Fund held a 8.0% cash weighting at month-end. The CVM has generated substantial value to investors over its long-term history driven by the combination of strong company-specific catalysts and a concentrated portfolio. We continue to look forward to strong results as we progress through 2020 and beyond.
We thank you for your continued support.
The CVM Team

Return since August 15, 2011 (Performance Start Date): 9.4%. | Returns are annualized for periods greater than one year. | Source: Morningstar
The CVM was not a reporting issuer offering its securities privately from August 8, 2011 until July 20, 2017, at which time it became a reporting issuer and subject to additional regulatory requirements and expenses associated therewith.
Unless otherwise specified, market and issuer data sourced from Capital IQ.
As the constituents in the Canadian Equity category largely focus on securities of a larger capitalization and CVM considers, and is invested, in all categories, including smaller and micro-cap securities, we have also shown how CVM ranks against constituents focused in the smaller cap category. The above list represents 6 of a total of 366 constituents in the Canadian Equity category and 5 of a total of 99 constituents in the Canadian Small/Mid Equity category.
The information contained herein provides general information about the Fund at a point in time. Investors are strongly encouraged to consult with a financial advisor and review the Simplified Prospectus and Fund Facts documents carefully prior to making investment decisions about the Fund. Commissions, trailing commissions, management fees and expenses all may be associated with mutual fund investments. Rates of returns, unless otherwise indicated, are the historical annual compounded returns including changes in unit value and reinvestment of all distributions and do not take into account sales, redemption, distribution or optional charges or income taxes payable by any unitholder that would have reduced returns. Mutual funds are not guaranteed; their values change frequently and past performance may not be repeated.
The Lipper Fund Awards are based on the Lipper Leader for Consistent Return rating, which is a risk-adjusted performance measure calculated over 36, 60 and 120 months. Lipper Leaders fund ratings do not constitute and are not intended to constitute investment advice or an offer to sell or the solicitation of an offer to buy any security of any entity in any jurisdiction. For more information, see lipperfundawards.com. Lipper Leader ratings change monthly. Lipper Fund Awards from Refinitiv, ©2019 Refinitiv. All rights reserved. Used under license. The Caldwell Canadian Value Momentum Fund Series A in the Canadian Equity Category for the 5-year period (out of a total of 69 funds) ending July 31, 2019. Lipper Leader ratings: 5 (3 years) and 5 (5 years).
FundGrade A+® is used with permission from Fundata Canada Inc., all rights reserved. The annual FundGrade A+® Awards are presented by Fundata Canada Inc. to recognize the “best of the best” among Canadian investment funds. The FundGrade A+® calculation is supplemental to the monthly FundGrade ratings and is calculated at the end of each calendar year. The FundGrade rating system evaluates funds based on their risk-adjusted performance, measured by Sharpe Ratio, Sortino Ratio, and Information Ratio. The score for each ratio is calculated individually, covering all time periods from 2 to 10 years. The scores are then weighted equally in calculating a monthly FundGrade. The top 10% of funds earn an A Grade; the next 20% of funds earn a B Grade; the next 40% of funds earn a C Grade; the next 20% of funds receive a D Grade; and the lowest 10% of funds receive an E Grade. To be eligible, a fund must have received a FundGrade rating every month in the previous year. The FundGrade A+® uses a GPA-style calculation, where each monthly FundGrade from “A” to “E” receives a score from 4 to 0, respectively. A fund’s average score for the year determines its GPA. Any fund with a GPA of 3.5 or greater is awarded a FundGrade A+® Award. For more information, see www.FundGradeAwards.com. Although Fundata makes every effort to ensure the accuracy and reliability of the data contained herein, the accuracy is not guaranteed by Fundata.
* Categories defined by Canadian Investment Funds Standards Committee ("CIFSC")
Publication date: June 13, 2020.


