Market Commentary
The S&P 500 index returned 11.7% in the fourth quarter of 2020 (“Q4”) and 16.3% for the full year. The Information Technology, Consumer Discretionary and Communication Services sectors led performance as mega-cap tech companies benefitted disproportionately from the shift to work, learn and play from home. In fact, near the end of July 2020, the combined market cap of Alphabet, Amazon, Apple, Facebook and Microsoft accounted for approximately 22% of the S&P 500 index. At the other end of the spectrum, the Energy sector recorded the worst performance following a precipitous decline in air travel and daily commuting, fears of lasting oversupply and growing public and private sector interest in alternative energy sources. In other underperforming sectors such as Real Estate, there will likely be some degree of permanent demand destruction.
Despite the divergence in performance, two common themes emerged across nearly every sector: 1) numerous management teams remarked that COVID-19 accelerated pre-existing market trends by 2-5 years and; 2) companies that invested in digital infrastructure and e-commerce capabilities prior to the pandemic were much better prepared to survive (and even thrive) in the new socially distanced environment.
Performance Summary
The Caldwell U.S. Dividend Advantage Fund Series F ("Fund") gained 8.3% in 2020 (and 4.4% in Q4) compared to 16.3% for the S&P 500 (and 11.7% in Q4)1. Full year performance was positively impacted by allocations to the Information Technology, Materials and Consumer Discretionary sectors. Allocations to the Consumer Staples, Financials and Industrials sectors were detractors of performance.
In Q4, positive contributors to performance were slightly different, with holdings in the Information Technology, Industrials and Health Care sectors leading the way. Allocations to the Consumer Staples, Consumer Discretionary and Materials sectors detracted from performance. Positive vaccine news towards the end of the quarter drove a change in investor sentiment and widespread re-positioning away from the “stay-at-home” winners to companies more likely to benefit from economic re-opening.
Contributors to Performance2
Qualcomm Inc. (“Qualcomm”) was a leading contributor of performance, gaining 73% for the full year (and 29.5% in Q4). As a leading supplier of advanced smartphone chipsets, the company is well positioned to benefit from the ongoing uptake of 5G phones, particularly in China where demand in 2020 recovered faster than expected. Additionally, sanctions on Huawei provide an opportunity for Qualcomm to gain market share in China as local phone makers look for substitute suppliers. With a long growth runway, increased content opportunities and highly probable market share gains, we believe Qualcomm will continue to cement its position as a market leader over the long term.
Microsoft Corporation (“Microsoft”) was another strong contributor of performance, returning 41% for the full year (and 5.8% in Q4). Work, learn and play from home dynamics drove strong demand for Microsoft’s office productivity suite, cloud computing services, personal electronics and gaming offerings. Taking aim at Zoom, the company executed a quick ramp up of its Teams platform which now boasts over 115 million daily active users. Additionally, the highly anticipated release of the next generation Xbox and a rumored Windows 10 refresh are likely to sustain momentum into 2021. In all, we remain enthusiastic about Microsoft’s long term growth prospects and ability to increase profitability as customers adopt additional services from a growing range of products.
Broadcom Inc. (“Broadcom”) gained 38.6% for the full year (and 20.2% in Q4) benefitting from data centre buildouts, 5G network expansion and Apple’s 5G phone launch in its semiconductor solutions business. The Infrastructure software segment (which now accounts for 25% of revenue) continues to gain momentum among its core Fortune 500 customer base and comes with above company-average margins. Broadcom continues to be a core holding given its strong growth outlook, free cash flow generation and dividend growth potential.
Detractors from Performance2
In the Consumer Staples sector, Tyson Foods Inc. (“Tyson”) was a key performance detractor, falling 29.2%* for the full year (and gaining +8.3% in Q4). Despite a portfolio of leading brands and lockdown orders that drove strong eat-at-home trends, Tyson suffered from weakness in its food service business, a high number of COVID-19 cases at its processing plants (and resulting absenteeism) as well as alleged price fixing lawsuits from governments and large fast food customers. However, eat-at-home trends should remain at elevated levels until more vaccine progress is made and the food service business should recover with the re-opening of service and hospitality businesses.
Church & Dwight Co., Inc. gained 24% for the full year (but fell 6.9% in Q4). The stock was dragged down in Q4 as investors repositioned away from “stay-at-home” stocks toward those levered to the economic re-opening. Despite recent weakness, the company should benefit from a lasting shift in consumer purchasing habits in key categories (such as more frequent vitamin and cleaning supply purchases). Church is also well positioned to capitalize on potential consumer trade down activity. The company’s acquisition strategy also helped drive above market growth over the last 3 years which we believe will continue in the near and medium term.
Portfolio Activity2
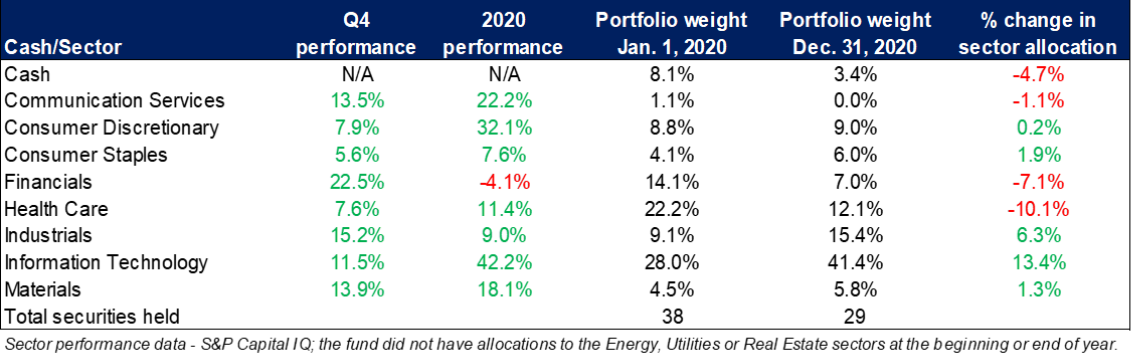
In 2020, the Fund initiated 13 new positions (including The Home Depot, Inc. (“Home Depot”), Fastenal Company (“Fastenal”) and Watsco, Inc. (“Watsco”) in Q4). The table below highlights a material re-weighting between sectors and a reduction in cash, reflecting greater concentration in companies that better align with our outlook. These are companies that navigate tough environments better than peers but also exit such periods relatively stronger such that market share, profitability and growth prospects are enhanced. We provide a brief overview of changes made to the portfolio and our updated outlook below.
Home Depot is North America’s largest home improvement (“HI”) retailer. In addition to a strong housing market supporting HI demand, Home Depot has proven itself to be a superior operator through cycles. Management continues to make investments that will serve both do it yourself (“DIY”) and professional customers better in-store and online. These initiatives expand the total addressable market and capture market share from (struggling) competitors, supporting top line growth, while generating operating leverage that should lead to margin expansion over time.
Fastenal is a leading industrial and construction supply company with a unique mix of standalone branch locations and stores located within customers’ facilities. The latter is an approximate $25 billion opportunity that ultimately allows Fastenal to increase wallet share of inventory spend while running at significantly lower operating costs (approximately 40-50% less than a standalone branch). Business has remained depressed through the pandemic however customer interest in the concept remains strong and the stock has historically performed well during the early stages of a recovery.
Watsco is the largest heating, ventilation, air conditioning and refrigeration (“HVACR”) distributor in the U.S. Several macro tailwinds provide a steady base of long term growth such as: 90 million HVACR systems that are 10+ years old; urban to suburban migration and; a greater focus on indoor air quality post COVID-19. At the company level, tech investments help customers grow faster, leading to higher transaction sizes and increased stickiness, and should lead to margin expansion over time. Acquisitions are also a key part of the growth strategy and should lead to share gains.
Outlook
Returning to an earlier point, the Fund invests in companies that can successfully navigate tough environments while emerging on the other side in a stronger position. With U.S. case counts at or near peak and potential challenges in passing all elements of the new stimulus bill, we believe the environment will remain challenging in the near term. Additionally, a high level of skepticism surrounding COVID-19 vaccines presents a risk that meaningful vaccination will not happen as quickly as the market expects. However, confirmation of U.S. election results removed an element of uncertainty and markets seem to be looking past the current weakness. In recent months, some investors have shifted into cyclical/value companies/sectors that underperformed in 2020 and tend to perform relatively well during the early stages of a cycle. While we do not attempt to predict market movements, we are fairly confident of two things: volatility will remain elevated in the near term and; improved vaccination uptake and a sustained period of low interest rates should provide a tailwind for equities over the medium term.
Dividend growth investing has been the foundation of the Caldwell U.S. Dividend Advantage Fund’s investment approach, as these stocks typically provide an attractive risk/reward profile over the long-term. As such, we believe our strategy of owning high quality, dividend growing stocks is an attractive way for investors to navigate this market.
1Caldwell U.S. Dividend Advantage Fund Series F returns as at December 31, 2020: 1 Year: 8.3%, 3 year: 8.4%, 5 year: 10.2%, Since Inception (June 19, 2015): 8.8%.
2Current investments, first purchased: Qualcomm Inc. – 10/29/2019; Microsoft Corporation – 7/20/2016; Broadcom Inc. – 11/1/2018; Tyson Foods Inc. – 10/24/2018; Church & Dwight Co., Inc. – 9/25/2020; Home Depot Inc. – 11/02/2020; Fastenal Company – 11/02/2020; Watsco Inc. – 12/08/2020.
All data is as of December 31, 2020 unless otherwise indicated. S&P 500 index, sector and individual stock returns are in U.S. dollar terms. Fund performance is reported on a Canadian dollar, total return basis.
The Fund was first offered to the public as a closed-end investment since May 28, 2015. Effective Nov. 15, 2018 the Fund was converted into an open-end mutual fund such that all units held were redesignated as Series F units. Performance prior to the conversion date would have differed had the Fund been subject to the same investment restrictions and practices of the current open-end mutual fund.
The information contained herein provides general information about the Fund at a point in time. Investors are strongly encouraged to consult with a financial advisor and review the Simplified Prospectus and Fund Facts documents carefully prior to making investment decisions about the Fund. Commissions, trailing commissions, management fees and expenses all may be associated with mutual fund investments. Rates of returns, unless otherwise indicated, are the historical annual compounded returns including changes in unit value and reinvestment of all distributions and do not take into account sales, redemption, distribution or optional charges or income taxes payable by any unitholder that would have reduced returns. Mutual funds are not guaranteed; their values change frequently and past performance may not be repeated. The payment of distributions should not be confused with a fund’s performance, rate of return or yield. If distributions paid are greater than the performance of the fund, your original investment will shrink. Distributions paid as a result of capital gains realized by a fund, and income and dividends earned by a fund, are taxable in your hands in the year they are paid. Your adjusted cost base (“ACB”) will be reduced by the amount of any returns of capital and should your ACB fall below zero, you will have to pay capital gains tax on the amount below zero.
Publication date: January 22, 2021.
12303168464egw4gwe4g
- Oksana Poyaskova
- Oksana Poyaskova
- Oksana Poyaskova
- Oksana Poyaskova
- Oksana Poyaskova
- Oksana Poyaskova
- Oksana Poyaskova
- Oksana Poyaskova
- Oksana Poyaskova
- Oksana Poyaskova
- Oksana Poyaskova
- Oksana Poyaskova
- Oksana Poyaskova
- Oksana Poyaskova
- Oksana Poyaskova
- Oksana Poyaskova
- Oksana Poyaskova
- Oksana Poyaskova
- Oksana Poyaskova
- Oksana Poyaskova
- Oksana Poyaskova
- Oksana Poyaskova
- Oksana Poyaskova
- Oksana Poyaskova
- Oksana Poyaskova
- Oksana Poyaskova
- Oksana Poyaskova
- Oksana Poyaskova
- Oksana Poyaskova
- Oksana Poyaskova
- Oksana Poyaskova
- Oksana Poyaskova
- Oksana Poyaskova
- Oksana Poyaskova
- Oksana Poyaskova
- Oksana Poyaskova
- Oksana Poyaskova
- Oksana Poyaskova
- Oksana Poyaskova
- Oksana Poyaskova
- Oksana Poyaskova
- Oksana Poyaskova
- Oksana Poyaskova
- Oksana Poyaskova
- Oksana Poyaskova
- Oksana Poyaskova
- Oksana Poyaskova
- Oksana Poyaskova
- Oksana Poyaskova
- Oksana Poyaskova
- Oksana Poyaskova
- Oksana Poyaskova
- Oksana Poyaskova
- Oksana Poyaskova
- Oksana Poyaskova
- Oksana Poyaskova
- Oksana Poyaskova
- Oksana Poyaskova
- Oksana Poyaskova
- Oksana Poyaskova
- Oksana Poyaskova
- Oksana Poyaskova
- Oksana Poyaskova
- Oksana Poyaskova
- Oksana Poyaskova
- Oksana Poyaskova
- Oksana Poyaskova
- Oksana Poyaskova
- Oksana Poyaskova
- Oksana Poyaskova
- Oksana Poyaskova
- Oksana Poyaskova
- Oksana Poyaskova
- Oksana Poyaskova
- Oksana Poyaskova
- Oksana Poyaskova
- Oksana Poyaskova
- Oksana Poyaskova
- Oksana Poyaskova
- Oksana Poyaskova
- Oksana Poyaskova
- Oksana Poyaskova
- Oksana Poyaskova
- Oksana Poyaskova
- Oksana Poyaskova
- Oksana Poyaskova
- Oksana Poyaskova
- Oksana Poyaskova
- Oksana Poyaskova
- Oksana Poyaskova
- Oksana Poyaskova
- Oksana Poyaskova
- Oksana Poyaskova
- Oksana Poyaskova
- Oksana Poyaskova
- Oksana Poyaskova
- Oksana Poyaskova
- Oksana Poyaskova
- Oksana Poyaskova
- Oksana Poyaskova
- Oksana Poyaskova
- Oksana Poyaskova
- Oksana Poyaskova
- Oksana Poyaskova
- Oksana Poyaskova
- Oksana Poyaskova
- Oksana Poyaskova
- Oksana Poyaskova
- Oksana Poyaskova
- Oksana Poyaskova
- Oksana Poyaskova
- Oksana Poyaskova
- Oksana Poyaskova
- Oksana Poyaskova
- Oksana Poyaskova
- Oksana Poyaskova
- Oksana Poyaskova
- Oksana Poyaskova
- Oksana Poyaskova
- Oksana Poyaskova
- Oksana Poyaskova
- Oksana Poyaskova
- Oksana Poyaskova
- Oksana Poyaskova
- Oksana Poyaskova
- Oksana Poyaskova
- Oksana Poyaskova
- Oksana Poyaskova
- Oksana Poyaskova
- Oksana Poyaskova
- Oksana Poyaskova
- Oksana Poyaskova
- Oksana Poyaskova
- Oksana Poyaskova
- Oksana Poyaskova
- Oksana Poyaskova
- Oksana Poyaskova
- Oksana Poyaskova
- Oksana Poyaskova
- Oksana Poyaskova
- Oksana Poyaskova
- Oksana Poyaskova
- Oksana Poyaskova
- Oksana Poyaskova
- Oksana Poyaskova
- Oksana Poyaskova
- Oksana Poyaskova
- Oksana Poyaskova
- Oksana Poyaskova
- Oksana Poyaskova
- Oksana Poyaskova
- Oksana Poyaskova
- Oksana Poyaskova
- Oksana Poyaskova
- Oksana Poyaskova
- Oksana Poyaskova
- Oksana Poyaskova
- Oksana Poyaskova
- Oksana Poyaskova
- Oksana Poyaskova
- Oksana Poyaskova
- Oksana Poyaskova
- Oksana Poyaskova
- Oksana Poyaskova
- Oksana Poyaskova
- Oksana Poyaskova
- Oksana Poyaskova
- Oksana Poyaskova
- Oksana Poyaskova
- Oksana Poyaskova
- Oksana Poyaskova
- Oksana Poyaskova
- Oksana Poyaskova
- Oksana Poyaskova
- Oksana Poyaskova
- Oksana Poyaskova
- Oksana Poyaskova
- Oksana Poyaskova
- Oksana Poyaskova
- Oksana Poyaskova
- Oksana Poyaskova
- Oksana Poyaskova
- Oksana Poyaskova
- Oksana Poyaskova
- Oksana Poyaskova
- Oksana Poyaskova
- Oksana Poyaskova
- Oksana Poyaskova
- Oksana Poyaskova
- Oksana Poyaskova
- Oksana Poyaskova
- Oksana Poyaskova
- Oksana Poyaskova
- Oksana Poyaskova
- Oksana Poyaskova
- Oksana Poyaskova
- Oksana Poyaskova
- Oksana Poyaskova
- Oksana Poyaskova
- Oksana Poyaskova
- Oksana Poyaskova
- Oksana Poyaskova
- Oksana Poyaskova
- Oksana Poyaskova
- Oksana Poyaskova
- Oksana Poyaskova
- Oksana Poyaskova
- Oksana Poyaskova
- Oksana Poyaskova
- Oksana Poyaskova
- Oksana Poyaskova
- Oksana Poyaskova
- Oksana Poyaskova
- Oksana Poyaskova
- Oksana Poyaskova
- Oksana Poyaskova
- Oksana Poyaskova
- Oksana Poyaskova
- Oksana Poyaskova
- Oksana Poyaskova
- Oksana Poyaskova
- Oksana Poyaskova
- Oksana Poyaskova
- Oksana Poyaskova
- Oksana Poyaskova
- Oksana Poyaskova
- Oksana Poyaskova
- Oksana Poyaskova
- Oksana Poyaskova
- Oksana Poyaskova
- Oksana Poyaskova
- Oksana Poyaskova
- Oksana Poyaskova
- Oksana Poyaskova
- Oksana Poyaskova
- Oksana Poyaskova
- Oksana Poyaskova
- Oksana Poyaskova
- Oksana Poyaskova
- Oksana Poyaskova
- Oksana Poyaskova
- Oksana Poyaskova
- Oksana Poyaskova
- Oksana Poyaskova
- Oksana Poyaskova
- Oksana Poyaskova
- Oksana Poyaskova
- Oksana Poyaskova
- Oksana Poyaskova
- Oksana Poyaskova
- Oksana Poyaskova
- Oksana Poyaskova
- Oksana Poyaskova
- Oksana Poyaskova
- Oksana Poyaskova
- Oksana Poyaskova
- Oksana Poyaskova
- Oksana Poyaskova
- Oksana Poyaskova
- Oksana Poyaskova
- Oksana Poyaskova
- Oksana Poyaskova
- Oksana Poyaskova
- Oksana Poyaskova
- Oksana Poyaskova
- Oksana Poyaskova
- Oksana Poyaskova
- Oksana Poyaskova
- Oksana Poyaskova
- Oksana Poyaskova
- Oksana Poyaskova
- Oksana Poyaskova
- Oksana Poyaskova
- Oksana Poyaskova
- Oksana Poyaskova
- Oksana Poyaskova
- Oksana Poyaskova
- Oksana Poyaskova
- Oksana Poyaskova
- Oksana Poyaskova
- Oksana Poyaskova
- Oksana Poyaskova
- Oksana Poyaskova
- Oksana Poyaskova
- Oksana Poyaskova
- Oksana Poyaskova
- Oksana Poyaskova
- Oksana Poyaskova
- Oksana Poyaskova
- Oksana Poyaskova
- Oksana Poyaskova
- Oksana Poyaskova
- Oksana Poyaskova
- Oksana Poyaskova
- Oksana Poyaskova
- Oksana Poyaskova
- Oksana Poyaskova
- Oksana Poyaskova
- Oksana Poyaskova
- Oksana Poyaskova
- Oksana Poyaskova
- Oksana Poyaskova
- Oksana Poyaskova
- Oksana Poyaskova
- Oksana Poyaskova
- Oksana Poyaskova
- Oksana Poyaskova
- Oksana Poyaskova
- Oksana Poyaskova
- Oksana Poyaskova
- Oksana Poyaskova
- Oksana Poyaskova
- Oksana Poyaskova
- Oksana Poyaskova
- Oksana Poyaskova
- Oksana Poyaskova
- Oksana Poyaskova
- Oksana Poyaskova
- Oksana Poyaskova
- Oksana Poyaskova
- Oksana Poyaskova
- Oksana Poyaskova
- Oksana Poyaskova
- Oksana Poyaskova
- Oksana Poyaskova
- Oksana Poyaskova
- Oksana Poyaskova
- Oksana Poyaskova
- Oksana Poyaskova
- Oksana Poyaskova
- Oksana Poyaskova
- Oksana Poyaskova
- Oksana Poyaskova
- Oksana Poyaskova
- Oksana Poyaskova
- Oksana Poyaskova
- Oksana Poyaskova
- Oksana Poyaskova
- Oksana Poyaskova
- Oksana Poyaskova
- Oksana Poyaskova
- Oksana Poyaskova
- Oksana Poyaskova
- Oksana Poyaskova
- Oksana Poyaskova
- Oksana Poyaskova
- Oksana Poyaskova